Amgix Now Load Tests: Mixed Workload
This post is part of Amgix Now Benchmarks Series
In the first two Amgix Now benchmark posts we looked at relevance (how well it is able to find what a user is looking for) and search performance under load (how many searches can it handle). This report focuses on Amgix Now performance under mixed concurrent workloads.
Most real-world applications don't just search. Documents are also being added, updated, and deleted. The mixed workload tests here are designed to simulate that workload: mostly search queries (80%), some upserts (19%), a few deletes (1%). The ability of the search engine to sustain this mixed workload profile under concurrency is an important metric to consider for the search engine viability in production use.
For context, we are also including results from three other popular search engines: Typesense, Meilisearch, and Elasticsearch. We subjected all engines (running with constrained CPU resources) to various levels of concurrent users (from 10 to 1500) to learn how they behave under pressure.
Jump to: Benchmarks, Results, or Takeaways
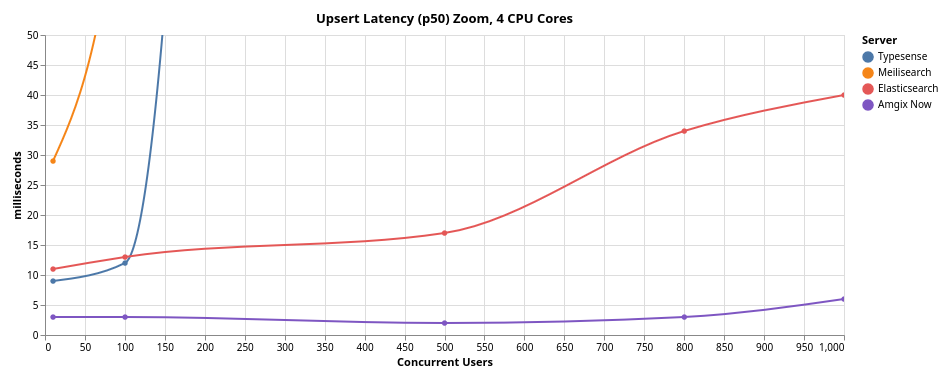
TL;DR in Charts
Typesense and Meilisearch were not tested above 500 concurrent users. See details below.
Macro View
Zoomed-In View
8 CPU Cores
For discussion on Amgix Now sync configuration see below
Benchmarks
Introduction
After testing Amgix Now relevance and search performance under load, we set out to find out how the engine performs under different loads of concurrent users in a mixed-workload scenario.
In these tests, virtual Locust users are firing searches, upserts, and deletes in 80%/19%/1% split. This is meant to simulate a real-world application usage where a user may search most of the time, add/update records sometimes, and occasionally delete a document.
As in the previous posts, we need context for the results, so we are also including results from three other popular search engines: Typesense, Meilisearch, and Elasticsearch, tested under the same conditions.
Test Setup
Expand collapsed sections for details:
Hardware
All tests are performed on a single bare-metal machine with the following specifications:
- CPU: AMD Ryzen™ 9 5900X × 12 cores (24 threads)
- RAM: 64GB
- GPU: NVIDIA GeForce RTX 5060 Ti (16GB)
- Storage: SSD
- OS: Ubuntu 24.04.4 LTS
Note
This is hardly a clean room test setup. It's not even a server. It's a desktop Ubuntu workstation with many other processes running on it at the same time: browser windows, other applications, etc. But we did not have any heavy processes running at the time of the tests.
Methodology
-
Dataset:
- 100K sequential document IDs.
- Each document has two fields:
nameandcontent name: 10 random words generated byFaker().sentence(10)content: 5 random paragraphs generated by"\n\n".join(Faker().paragraphs(5))- Collection/index pre-populated to around 95K records.
-
Queries: 5 random words generated by
Faker().sentence(5) - Random English words for both documents and search queries are meant to somewhat defeat any internal results caching strategies of the search engines.
- Test Harness: Locust with 16 worker processes.
- Locust users fire search requests with a random
0.1to0.5seconds delay. - Search/Upsert/Delete ratio for the tests is
80/19/1. - Upserts and deletes are done for random document IDs.
- Because the dataset is mostly populated, most of the upserts are updates to the existing documents, some land on non-existent IDs and are added.
- Errors for deletion of non-existent documents are ignored.
-
Procedure:
- Start a search engine container with the single pre-populated collection/index.
- Ramp up number of Locust users to a desired level.
- Let the system settle for a bit.
- Reset Locust stats.
- Let the system run for a few minutes.
- Take a screenshot of the Locust UI with metrics.
- Record the metrics from the screenshot.
-
All search engines were running in docker containers with a 4 CPU core limit (except for the last configuration tested, where we introduced 8 CPU cores). Memory was not limited, Elasticsearch heap was set to 16GB.
Server Versions
The following server versions were used for these tests:
- Typesense: 29.0
- Meilisearch: 1.37
- Elasticsearch: 8.19.6
- Amgix Now: 0.1.2
Disclaimer
We are not experts at running and configuring third-party search engines. While we studied the settings and tried to give every system appropriate configuration for the test, it's quite possible that we've missed something and a better configuration may exist. If you notice something in the configuration of these systems that may have affected the test results, please let us know, we'll be happy to re-test with a more optimal configuration.
Collection/Index and Query Configurations
-
Search query results were limited to
10on all systems. -
Typesense:
- We have disabled typo tolerance for the queries. The data contains no typos, so there is no reason to do extra work. Both
num_typosandtypo_tokens_thresholdwere set to0.prefixwas set tofalse. The rest was left at defaults. drop_tokens_thresholdwas also left at default setting. Setting it to zero does improve performance, but at the cost of not finding many relevant documents. See our discussion on the topic in the Typesense on Natural Language Datasets section of the previous benchmarks.
- We have disabled typo tolerance for the queries. The data contains no typos, so there is no reason to do extra work. Both
-
Meilisearch:
- For the same reasons as with Typesense, we disabled typo tolerance on the index. The rest of the settings used defaults.
-
Elasticsearch:
- We used Standard Analyzer with
lowercase,stopand an English stemmer on the index.fuzzinesswas set to0,typeset tomost_fields.
- We used Standard Analyzer with
-
Amgix Now:
- We used
full_texttokenizer to match the other systems (lowercasing, stemming, and stopword removal are done by default).
- We used
Results
Amgix Now Write Path Execution Mechanics
Amgix Now doesn't just add/update/delete a document. It executes a synchronous Read-Modify-Write deduplication path for every document mutation:
For each request, the engine acquires a lock, reads the existing document state from the storage backend, evaluates deduplication rules, vectorizes the data (for upserts), commits the write (or deletes), and updates the collection statistics.
Light Load (10-100 Users)
RPS, as reported by Locust UI, fluctuates; the values in the tables below represent what was captured in our screenshots.
10 Concurrent Users
At the lightest load of 10 concurrent users, all engines are fast, but you can already notice some of the architectural differences that emerge between the read (search) and write (upsert/delete) paths.
| Typesense | Meilisearch | Elasticsearch | Amgix Now | |
|---|---|---|---|---|
| search p50 (ms) | 5 | 3 | 4 | 3 |
| upsert p50 (ms) | 9 | 29 | 11 | 3 |
| delete p50 (ms) | 8 | 42 | 11 | 2 |
| search p95 (ms) | 9 | 6 | 6 | 4 |
| upsert p95 (ms) | 15 | 88 | 17 | 3 |
| delete p95 (ms) | 11 | 80 | 14 | 3 |
| search RPS | 25.8 | 28.0 | 25.4 | 26.0 |
| upsert RPS | 5.8 | 4.8 | 6.5 | 6.6 |
| delete RPS | 0.3 | 0.3 | 0.5 | 0.4 |
| Total RPS | 31.9 | 33.1 | 32.4 | 33.1 |
100 Concurrent Users
At 100 concurrent users, the search/write differences amplify.
| Typesense | Meilisearch | Elasticsearch | Amgix Now | |
|---|---|---|---|---|
| search p50 (ms) | 5 | 3 | 5 | 3 |
| upsert p50 (ms) | 12 | 82 | 13 | 3 |
| delete p50 (ms) | 11 | 85 | 12 | 2 |
| search p95 (ms) | 9 | 5 | 7 | 5 |
| upsert p95 (ms) | 25 | 360 | 23 | 5 |
| delete p95 (ms) | 24 | 420 | 24 | 4 |
| search RPS | 261.6 | 244.9 | 258.0 | 262.6 |
| upsert RPS | 63.1 | 57.8 | 59.6 | 62.6 |
| delete RPS | 2.8 | 3.4 | 3.9 | 3.2 |
| Total RPS | 327.5 | 306.1 | 321.5 | 328.4 |
Medium Load (500 Users)
500 Concurrent Users
At 500 concurrent users, differences we noticed at the lower load levels become stark.
A Note About Virtual Locust Users
A Locust user fires requests sequentially: search, search, search, upsert, search, delete, etc. If some of the requests take a long time to respond, the user is basically stalled. It spends more time waiting than firing requests. You can see in the data below that for the engines with slow write responses, search RPS is low. This is not because those engines couldn't process more search requests, but because the Locust test harness never fires enough of them.
| Typesense | Meilisearch | Elasticsearch | Amgix Now | |
|---|---|---|---|---|
| search p50 (ms) | 5 | 3 | 4 | 2 |
| upsert p50 (ms) | 1800 | 3400 | 17 | 2 |
| delete p50 (ms) | 1900 | 3400 | 17 | 2 |
| search p95 (ms) | 11 | 4 | 6 | 5 |
| upsert p95 (ms) | 2100 | 7400 | 34 | 6 |
| delete p95 (ms) | 2100 | 7400 | 34 | 5 |
| search RPS | 558.6 | 429.1 | 1295.9 | 1315.7 |
| upsert RPS | 130.3 | 105.1 | 302.5 | 311.9 |
| delete RPS | 7.1 | 5.0 | 14.7 | 17.8 |
| Total RPS | 696.0 | 539.2 | 1613.1 | 1645.4 |
Heavy Load (800-1000 Users)
Note
For the reasons we explained in the 500 users section and due to the timings observed for the write paths of Typesense and Meilisearch engines, we have decided to exclude them from testing at the higher load levels.
At this point, we added another configuration to the mix: Amgix Now (sync).
By default, in the Amgix Now write path (upserts/deletes), the engine doesn't wait for the backend database to finish indexing. It only waits for the backend to acknowledge that a transaction was received. A new document may not appear in a search immediately, though it usually does very quickly. This, of course, provides for faster writes in Amgix Now.
Info
This is similar to Elasticsearch's Near Real-Time (NRT) search, but without the 1 second time window.
However, this behavior is configurable. By setting the environment variable AMGIX_NOW_SYNC_DB_WRITES to true, you can force Amgix Now to perform completely synchronous writes (it waits for the database to index the records). In this "sync" configuration you get immediate consistency of your search index, but at the expense of the slower write operations.
In order to learn how the system behaves with this setting, we tested both configurations (default and sync) side-by-side.
800 Concurrent Users
| Elasticsearch | Amgix Now | Amgix Now (sync) | |
|---|---|---|---|
| search p50 (ms) | 100 | 4 | 3 |
| upsert p50 (ms) | 34 | 3 | 39 |
| delete p50 (ms) | 33 | 3 | 34 |
| search p95 (ms) | 250 | 50 | 10 |
| upsert p95 (ms) | 75 | 20 | 180 |
| delete p95 (ms) | 75 | 16 | 140 |
| search RPS | 1677.8 | 2079.8 | 2064.5 |
| upsert RPS | 394.9 | 496.9 | 474.4 |
| delete RPS | 20.0 | 26.2 | 26.9 |
| Total RPS | 2092.7 | 2602.9 | 2565.8 |
Observations
The contrast between the default and sync configurations of Amgix Now is interesting:
- In the sync configuration Amgix Now upserts and deletes got predictably slower. In fact, they are the slowest of the three systems/configurations tested. Both Elasticsearch and Amgix Now (default) have "asynchronous" write semantics.
- The surprising part, however, is that despite writes being completely synchronous, the p50 of the write operations is only slightly behind Elasticsearch, and is under 40ms, which is still very fast.
- But look at what happened to the search latencies. Searches got faster.
Amgix Now (sync)serves 2064 search requests with 3ms p50 and 10ms p95, while performing hundreds of synchronous writes to the database.
This last result is counterintuitive, until you consider what happens under the hood:
- At this load the engines perform close to the saturation point of all 4 CPU cores.
- When writes are slower (waiting more), search path gets to use more CPU cycles and is able to serve requests faster.
1000 Concurrent Users
At 1000 users, all 4 CPU cores are saturated. Amgix Now writes are slower. Nevertheless, searches are still sub-50ms and in the case of sync configuration, Amgix Now serves 2366 requests per second with 13ms p50.
| Elasticsearch | Amgix Now | Amgix Now (sync) | |
|---|---|---|---|
| search p50 (ms) | 210 | 49 | 13 |
| upsert p50 (ms) | 40 | 6 | 58 |
| delete p50 (ms) | 42 | 5 | 47 |
| search p95 (ms) | 370 | 210 | 150 |
| upsert p95 (ms) | 77 | 38 | 260 |
| delete p95 (ms) | 76 | 34 | 190 |
| search RPS | 1732.4 | 2340.3 | 2366.4 |
| upsert RPS | 397.2 | 542.9 | 551.7 |
| delete RPS | 19.2 | 28.7 | 29.5 |
| Total RPS | 2148.8 | 2881.9 | 2947.6 |
8 CPU Cores (1500 Users)
We were curious how Amgix Now does at even higher load with more CPU cores. Here are the numbers:
| Elasticsearch | Amgix Now | Amgix Now (sync) | |
|---|---|---|---|
| search p50 (ms) | 190 | 63 | 30 |
| upsert p50 (ms) | 43 | 8 | 45 |
| delete p50 (ms) | 39 | 7 | 38 |
| search p95 (ms) | 370 | 160 | 110 |
| upsert p95 (ms) | 87 | 20 | 240 |
| delete p95 (ms) | 85 | 17 | 170 |
| search RPS | 2732.9 | 3324.2 | 3481.4 |
| upsert RPS | 659.8 | 780.4 | 808.3 |
| delete RPS | 34.2 | 42.8 | 40.4 |
| Total RPS | 3426.9 | 4147.4 | 4330.1 |
Amgix Now write paths remained very fast, 7-8ms p50, processing about 820 ops per second. Searches are still fast with 63ms p50, while serving 3324 RPS.
Pure Writes on Amgix Now
As one final data point, we ran pure upsert workload on Amgix Now (default async config, 4 CPU cores). We wanted to see where the ceiling was. We ramped it up to 1500 Locust users, doing upserts only. After over 1M upserts, the numbers were:
| Amgix Now | |
|---|---|
| p50 (ms) | 24 |
| p95 (ms) | 550 |
| RPS | 2946 |
| Errors | 0 |
Takeaways
Amgix Now maintained single-digit millisecond p50 latencies across all operations up to 800 concurrent users on 4 CPU cores. Upsert/delete numbers are in single-digits across all tested configurations. At 1000 users, as CPU resources began to saturate, search p50 grew to 49ms. At 1500 users on 8 CPU cores, Amgix Now was able to serve 4147 (default) and 4330 (sync) total RPS.
Enabling fully synchronous writes (AMGIX_NOW_SYNC_DB_WRITES=true) resulted in faster search latencies at the cost of slower writes - a useful tradeoff for applications that prioritize search speed over write throughput. But the tests also demonstrate that synchronous writes, even at very high concurrency, are still pretty fast.